Projects
-
filter_dramaWorld Indicator ETL
Skills: BigQuery Jupyter Postgres Python API SQL
In this project I used Open Data available from Google's BigQuery Public Database to create a Postgres Database. The goal was to link the datasets by Country which would make for quick analyses. The datasets were quite dense which became an issue for simple relational indices to be created, this led me to realize I was on the path to building a data lake, which was out of scope. This project consists mainly of Jupyter notebooks with a Postgres Database.
The repository is available for access here: world-indicators-etl
-
emailWeb Scraping for 48,000 Emails
Skills: Python Splinter MongoDB Jupyter HTML CSS JavaScript
Need emails for a survey? I can scrape them...
I scraped 48,000 email addresses from 20 websites. -
whatshotNational Wildfires Visualized
Skills: Python Flask MongoDB HTML CSS JavaScript Bootstrap 4 Highcharts.js API JSON
This project started with a large historical database composed of National Wildfire records collected between 1992 and 2015, totaling 1.88 Million Wildfire incidents. MongoDB was the chosen database for the project because of the speed and simplicity of use. After loading the data into the database, a Flask server app was created to allow interactive access to the data via the dashboard. The dashboard consisted of various charts produced with Highcharts.js using JavaScript calls to the API serving the MongoDB data.
The project repository can be viewed here: National Wildfires Visualized
-
placeUSGS Earthquake Map
Skills: Leaflet.js HTML CSS JavaScript API GEOJSON
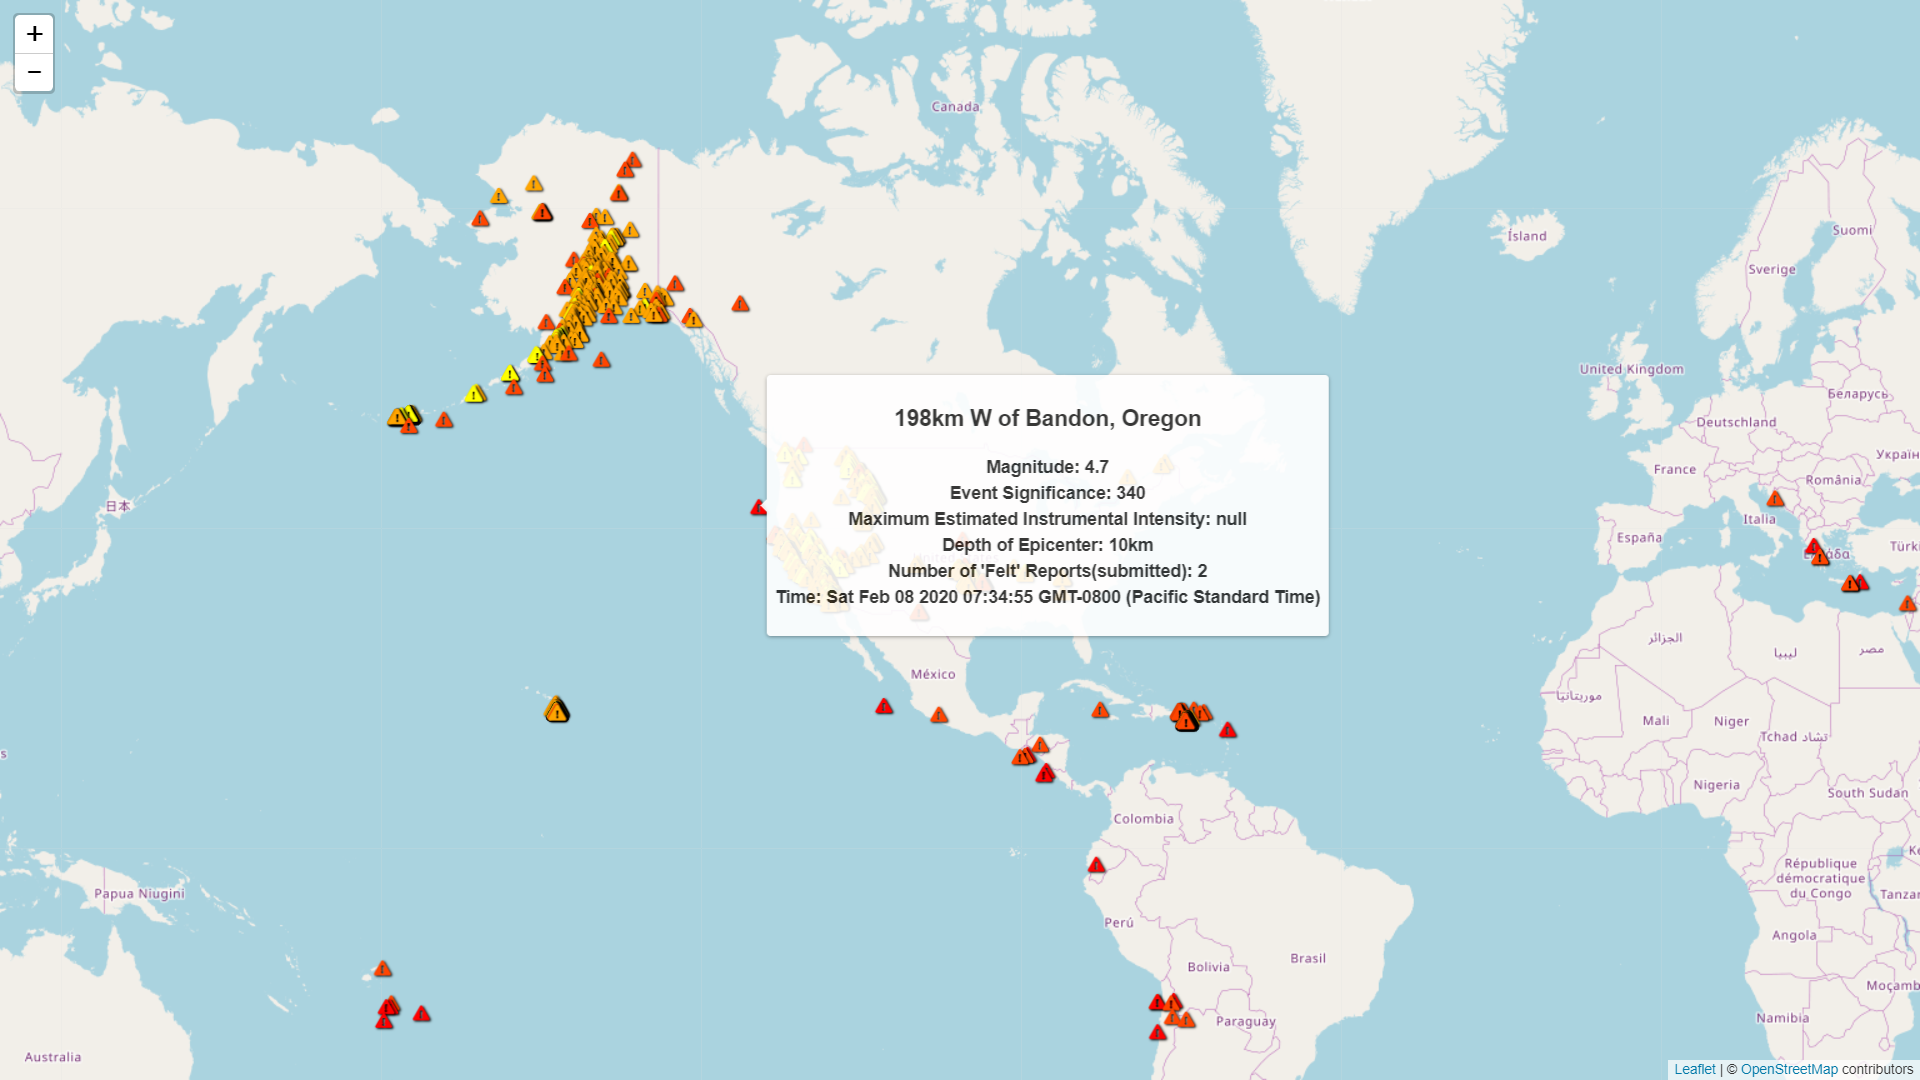
This map shows the weekly Earthquakes recorded by the United States Geological Society. The data is real-time and updated every minute. from the USGS Earthquake Hazards Program. I used the Leaflet.js package to build the map and place the markers. I decided to use Exclamation Triangles from the FontAwesome 5 library. These markers were then color-coded based on the earthquake's magnitude.
Magnitude Marker Color Less than or equal to 1.0: Yellow Greater than 1.0 and less than or equal to 2.5: Orange Greater than 2.5 and less than or equal to 4.5: Orange-Red Greater than 4.5: Red The API is available for access here: USGS Earthquake API
The Map is available for access here: USGS Earthquake Map
The repository is available for access here: USGS Earthquake Map repository![Map of world, marked with the earthquakes from the last week.]()
-
trending_upwardDengAI
Skills: Python TensorFlow HTML CSS JavaScript API CSV
This project aims to predict local epidemics of dengue fever using environmental data collected by U.S. Federal Government agencies. Using historical data for San Juan, Puerto Rico and Iquitos, Peru, predictions were generated with the machine learning tools Google TensorFlow and Facebook Prophet. Raw data is available at DrivenData.
Tools our team used:
- Tiaga Kanban for workflow management
- Python with TensorFlow and Facebook Prophet machine learning modules
- Jupyter and Colab notebooks for machine learning exploration
- Javascript, HTML, and CSS for webpage design
- Tableau and Highcharts for visualizations
Our goal was to predict the number of dengue cases each week in each location based on environmental variables describing changes in temperature, precipitation, and vegetation. Predictions were generated based on a dataset with weekly cases from 1991 to 2007 for San Juan and 2001 to 2009 for Iquitos. Two prediction models were used. Facebook Prophet forecasts time series data based on an additive model where non-linear trends are fit with yearly, weekly, and daily seasonality, plus holiday effects. TensorFlow is a Deep Learning library developed by Google, we developed a simple Long Short-Term Memory(LSTM) model.
San Juan Predictions
![]()
Iquitos Predictions
![]()
As seen in both of the above graphs plotting the time series predictions over the training and testing true values, both of the machine learning models aren’t able to accurately predict large spikes in Dengue Fever. While neither of these models are perfectly tuned, fine tuning a machine learning model takes quite a bit of hypothesis testing and therefore time, there seems to be an obvious need to bring in more related data in order to identify potential causal factors for the big spikes in the number of infected individuals per week. Even though correlation coefficient isn’t a direct measurement of a feature variables impact on a target variables outcome, it still gives a good indication of features that can help a machine learning model predict more accurately. San Juan’s environmental data features have a correlation coefficient range of -0.12 to 0.19 with respect to the number of cases per week, and Iquitos’s range is -0.13 to 0.23. This shows a relationship between environmental factors and the number of Dengue cases per week exists, but none of the variables have an extremely strong proportional or inverse relationship to explain the large fluctuations in the trend.
The repository can be accessed here: DengAI -
webMission to Mars
Skills: Python Flask HTML CSS JavaScript Bootstrap 4 API JSON
I created a web page, using basic Bootstrap 4, that displayed various data and information about the planet Mars, such as weather from tweets and satellite images. This data and information was scraped and mined from various sources on the internet. Python allowed me to quickly build a script to get the job done. I used the python packages Splinter and Beautiful Soup to access the webpages, then navigate them by clicking links and selecting HTML elements before extracting the HTML or image data I was going to use. This data was then injeted into the webpage I built using the Flask web development package to display this aggregate information in an easy to digest manner.
The webpage can be viewed here: Mission to Mars
The repository can be accessed here: Mission to Mars
The scraping script:from splinter import Browser from splinter.exceptions import ElementDoesNotExist from bs4 import BeautifulSoup as bs import time def scrape(): executable_path = {'executable_path': 'chromedriver.exe'} browser = Browser('chrome', **executable_path, headless=True) ## News title and teaser url_news = 'https://mars.nasa.gov/news/' browser.visit(url_news) html = browser.html soup = bs(html, 'html.parser') time.sleep(4) news_title = soup.find('div', class_='content_title') news_title = news_title.text news_p = soup.find('div', class_='article_teaser_body') news_p = news_p.text ## JPL Mars Space Images - Featured Image url_feat_img = 'https://www.jpl.nasa.gov/spaceimages/?search=&category=Mars' browser.visit(url_feat_img) html = browser.html soup = bs(html, 'html.parser') featured_image_url = 'https://www.jpl.nasa.gov' + soup.find('a', id='full_image')['data-fancybox-href'] ## Mars Weather url_mars_weather = 'https://twitter.com/marswxreport?lang=en' browser.visit(url_mars_weather) html = browser.html soup = bs(html, 'html.parser') for tweet in soup.find_all('div', class_='js-tweet-text-container'): if (tweet.p.text[:11] == 'InSight sol'): mars_weather = tweet.p.text break ## Mars Facts url_mars_facts = 'https://space-facts.com/mars/' browser.visit(url_mars_facts) html = browser.html soup = bs(html, 'html.parser') mars_facts_table = f"{soup.find( 'table', id='tablepress-p-mars-no-2' )} " ## Mars Hemispheres url_mars_hemis = 'https://astrogeology.usgs.gov/search/results?q=hemisphere+enhanced&k1=target&v1=Mars' browser.visit(url_mars_hemis) html = browser.html soup = bs(html, 'html.parser') hemisphere_image_urls = [] for link in soup.find_all('div', class_='description'): hemisphere_image_urls.append({"title ": link.h3.text[:-9]}) img_page = browser.visit('https://astrogeology.usgs.gov' + link.a['href']) html = browser.html img_soup = bs(html, 'html.parser') for each in img_soup.find_all('a'): if (each.text == 'Sample'): img_url = each['href'] break hemisphere_image_urls.append({"img_url ": img_url}) data = {'news_title': news_title, 'news_p': news_p, 'featured_image_url': featured_image_url, 'mars_weather': mars_weather, 'mars_facts_table': f'{mars_facts_table}', 'hemisphere_image_urls': hemisphere_image_urls} return data

A little about me...
Bryan Souza is a Data Specialist with an expertise in Real Estate. Bryan earned a Data Analytics and Visualization certificate from the UC Davis College of Continuing and Professional Education. Python came easy as he taught himself using the popular Pandas Data Analytics package. These new skills complement Bryan's hunger and determination for finding new information and creating success through positive action.

Send Me a Message and Let's Connect
If you are interested in collaborating or want to talk, please feel free to contact me.
I will get back to you shortly.


LinkedIn
Github
Kaggle
Data Analytics Slack
Buy me a coffee!